Table of Contents
1. Introduction
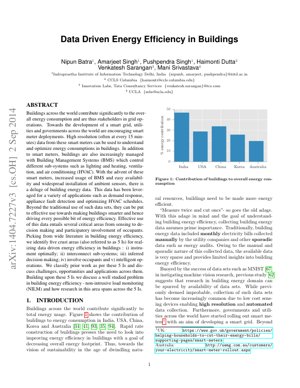
Buildings are major contributors to global energy consumption, as illustrated in Figure 1 which shows their significant share in countries like India, USA, China, Korea, and Australia. The push for sustainability and the proliferation of smart meters, Building Management Systems (BMS), and ambient sensors have created a deluge of building energy data. This data presents an unprecedented opportunity to move beyond traditional, sparse energy audits and monthly bills towards a continuous, data-driven understanding of building performance. The core challenge and opportunity lie in effectively leveraging this data to drive energy efficiency.
Key Statistic
Buildings contribute between 20% to 40% of total energy consumption in major economies like the USA, China, and India.
2. The 5 I's Framework for Data-Driven Energy Efficiency
The paper proposes a comprehensive framework encapsulated as the "5 I's" to realize data-driven energy efficiency in buildings. This framework structures the journey from raw data collection to actionable intelligence.
2.1 Instrument Optimally
This involves the strategic deployment of sensing infrastructure. It's not just about collecting more data, but the right data at the right granularity and frequency. This includes smart meters (providing aggregate consumption data at intervals like 15 minutes), sub-metering for specific systems (HVAC, lighting), and ambient sensors (temperature, occupancy, light levels). The goal is to create a cost-effective sensor network that provides sufficient fidelity for analysis without unnecessary complexity.
2.2 Interconnect Sub-systems
Modern buildings contain siloed systems: HVAC, lighting, security, and plug loads often operate independently. This pillar emphasizes integrating these systems to share data and enable coordinated control. For example, occupancy data from security sensors can inform HVAC and lighting schedules, leading to significant savings. Interoperability standards and middleware are key technical challenges here.
2.3 Inferred Decision Making
This is the analytics core. It involves applying machine learning and statistical models to the collected and interconnected data to extract insights. Applications include:
- Fault Detection & Diagnostics (FDD): Identifying malfunctioning equipment (e.g., a stuck damper, a faulty chiller) by comparing expected vs. actual performance patterns.
- Load Forecasting: Predicting short-term and long-term energy demand to optimize grid interactions and on-site generation.
- Pattern Recognition: Understanding typical usage profiles to identify anomalies or inefficiencies.
2.4 Involve Occupants
Occupant behavior is a critical, often unpredictable, factor in building energy use. This pillar focuses on moving occupants from passive consumers to active participants. Strategies include providing personalized energy feedback via dashboards, implementing gamification to encourage energy-saving behaviors, and designing adaptive systems that learn from and respond to occupant preferences while nudging towards efficiency.
2.5 Intelligent Operations
This is the culmination, where insights from inference and occupant feedback are translated into automated or semi-automated control actions. It involves closed-loop systems that dynamically adjust building operations—like HVAC setpoints, lighting levels, and blind positions—in real-time based on current conditions, forecasts, and occupancy to minimize energy use while maintaining comfort.
3. Case Study: Non-Intrusive Load Monitoring (NILM)
The paper uses NILM as a well-studied problem that spans all 5 I's. NILM aims to disaggregate total building electricity consumption (from a single smart meter) into individual appliance contributions.
- Instrumentation: Relies on a single, optimally placed smart meter.
- Interconnection: Its output (appliance-level data) can feed into other systems (e.g., an FDD module for appliance health).
- Inference: Core of NILM involves sophisticated signal processing and machine learning algorithms (e.g., Hidden Markov Models, deep learning) to identify appliance signatures.
- Involvement: Provides occupants with detailed breakdowns of their energy use, empowering them to change behavior.
- Intelligent Operations: Disaggregated data can trigger automated actions, like turning off a forgotten appliance identified as "on."
4. Technical Details & Mathematical Formulation
A simplified formulation for the NILM problem, a key inference task, can be expressed as follows:
Let the aggregate power signal from the smart meter at time $t$ be $y_t$. This signal is assumed to be the sum of the power consumption of $N$ individual appliances plus noise:
$y_t = \sum_{i=1}^{N} x_t^{(i)} + \epsilon_t$
where $x_t^{(i)}$ is the power draw of appliance $i$ at time $t$, and $\epsilon_t$ is measurement noise. The goal of NILM is to estimate the state vector $\mathbf{s}_t = [s_t^{(1)}, s_t^{(2)}, ..., s_t^{(N)}]$, where $s_t^{(i)} \in \{0, 1\}$ (OFF/ON for a simple binary appliance), or a continuous power value, given only the observed sequence $\mathbf{y}_{1:T} = [y_1, y_2, ..., y_T]$. This is often modeled as a factorial Hidden Markov Model (FHMM).
5. Experimental Results & Chart Description
Figure 1 Description (Referenced from PDF): The chart is a bar graph titled "Contribution of buildings to overall energy consumption." The x-axis lists five countries: India, USA, China, Korea, and Australia. The y-axis represents the percentage of total energy consumption. Each country has a bar showing its respective percentage, visually indicating that buildings account for a substantial and varying portion (likely between 20% and 40% based on typical data) of national energy use. This figure underscores the global significance of the building sector as a primary energy consumer and the massive potential impact of efficiency improvements.
Note: The provided PDF excerpt does not contain detailed experimental results for a specific algorithm. The focus is on the conceptual framework.
6. Analysis Framework: A Non-Code Example
Consider analyzing a commercial office building's high weekend energy use.
- Instrument/Interconnect: Data streams are gathered: whole-building kW from the smart meter, HVAC system status from BMS, and badge-swipe data from security system (as a proxy for occupancy).
- Infer: A simple correlation analysis is run. It reveals high energy consumption on Saturdays despite near-zero badge swipes. A clustering algorithm (like k-means) on HVAC power data might show one AHU unit consistently operating at a high base load.
- Involve: The facility manager is presented with a dashboard showing: "Weekend energy is 60% of weekday average. Primary driver: AHU-3 runs continuously."
- Intelligent Operation: An automated rule is created in the BMS: "If day is Saturday/Sunday AND security system occupancy count is zero for >2 hours, set AHU-3 to unoccupied mode." The system then implements this, and energy use is monitored for verification.
7. Application Outlook & Future Directions
- Grid-Interactive Efficient Buildings (GEBs): Buildings will not just be efficient but actively support the grid through demand response, frequency regulation, and virtual power plant aggregation, as envisioned by the U.S. Department of Energy.
- Deep Learning Integration: Wider adoption of deep learning models (CNNs for load shape analysis, Transformers for sequence prediction) for more accurate FDD, forecasting, and NILM, moving beyond traditional HMMs.
- Digital Twins: Creation of high-fidelity virtual replicas of buildings that simulate energy flows in real-time, allowing for scenario testing and predictive maintenance without disrupting actual operations.
- Privacy-Preserving Analytics: Development of federated learning and differential privacy techniques to gain insights from aggregated building data without compromising individual occupant or tenant privacy.
- Circular Economy Integration: Using operational data to inform material and component life-cycle analysis, facilitating reuse and recycling in line with frameworks from the Ellen MacArthur Foundation.
8. References
- Batra, N., Singh, A., Singh, P., Dutta, H., Sarangan, V., & Srivastava, M. (2014). Data Driven Energy Efficiency in Buildings. arXiv preprint arXiv:1404.7227.
- U.S. Department of Energy. (n.d.). Grid-Interactive Efficient Buildings. Retrieved from energy.gov
- Zhu, J., Park, T., Isola, P., & Efros, A. A. (2017). Unpaired Image-to-Image Translation using Cycle-Consistent Adversarial Networks. Proceedings of the IEEE International Conference on Computer Vision (ICCV). (CycleGAN as an example of advanced generative models relevant to synthetic data generation for building simulations).
- Ellen MacArthur Foundation. (n.d.). Circular Economy Introduction. Retrieved from ellenmacarthurfoundation.org
- Zhao, B., Stankovic, L., & Stankovic, V. (2016). On a training-less solution for non-intrusive appliance load monitoring using graph signal processing. IEEE Access, 4, 1784-1799.
9. Analyst's Perspective: The 5 I's Decoded
Core Insight: The paper's real value isn't in the individual technologies it lists—smart meters, BMS, ML—which are well-known. Its brilliance lies in the 5 I's framework, which provides a desperately needed strategic roadmap. It correctly identifies that the building efficiency problem is a systems integration and human-centric challenge, not just a data science puzzle. Most failures occur not due to bad algorithms, but because of poor instrumentation strategy, siloed systems, or ignored occupant behavior.
Logical Flow: The framework's progression is logical and iterative. You can't have intelligent operations (I5) without first making inferred decisions (I3), which is impossible without interconnected data (I2) from optimal instruments (I1). Crucially, it inserts "Involve Occupants" (I4) right in the middle, acknowledging that automation alone fails if it alienates the people inside. This mirrors findings from human-computer interaction research in sustainable systems.
Strengths & Flaws: Strengths: The framework is holistic, memorable, and action-oriented. Using NILM as a cross-cutting case study is a powerful pedagogical tool. It anticipates the IoT and data explosion in buildings. Flaws: The paper, being a 2014 perspective, understandably underweights the seismic impact of modern deep learning (e.g., Transformer models for time-series forecasting) and the computational/cybersecurity challenges of I2 and I5. It also glosses over the monumental economic and contractual barriers to interconnecting proprietary building subsystems, a hurdle that remains largely unsolved today.
Actionable Insights:
- For Building Owners/Operators: Use the 5 I's as a maturity model. Audit your current state against each "I." Most are stuck at I1 (collecting data). Prioritize projects that advance you to I2 (integration) and I4 (occupant engagement)—these often have higher ROI than chasing marginal gains in I3 (model accuracy).
- For Technology Vendors: Stop selling point solutions. Package your offerings to explicitly address one or more of the 5 I's. A BMS vendor should talk about its open APIs for I2, its built-in analytics for I3, and its occupant app for I4.
- For Researchers: The low-hanging fruit in pure I3 (algorithm development) is largely picked. The next breakthroughs will be at the intersections: I2+I3 (privacy-preserving distributed learning across systems), I3+I4 (explainable AI for occupant feedback), and I4+I5 (human-in-the-loop adaptive control). Focus there.