1. Introduction
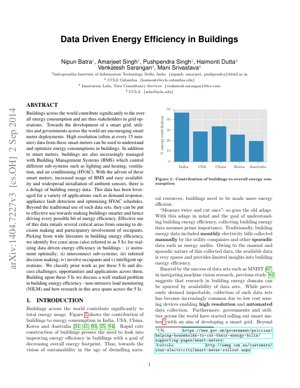
Buildings are major contributors to global energy consumption, as illustrated in Figure 1 which shows their significant share in countries like India, USA, China, Korea, and Australia. The push for sustainability and the proliferation of smart meters, Building Management Systems (BMS), and ambient sensors have created a deluge of building energy data. This data presents an unprecedented opportunity to move beyond traditional, sparse energy audits and monthly bills towards continuous, high-resolution understanding and optimization of building energy use. The central challenge is effectively leveraging this data across the entire spectrum from sensing to decision-making and occupant engagement.
Building Energy Contribution (Figure 1)
Data from the PDF indicates buildings account for a substantial portion of national energy use, e.g., approximately 30-40% in developed economies like the USA and Australia, highlighting the critical need for efficiency measures.
2. The 5 I's Framework for Data-Driven Energy Efficiency
The paper proposes a comprehensive framework encapsulated by five key areas, termed the "5 I's," to realize data-driven energy efficiency in buildings.
2.1 Instrument Optimally
This involves the strategic deployment of sensors (smart meters, BMS points, ambient sensors) to collect high-resolution, relevant data without unnecessary redundancy or cost. The goal is to achieve sufficient data fidelity for downstream analytics while considering economic constraints.
2.2 Interconnect Sub-systems
Modern buildings contain siloed systems (HVAC, lighting, security). This pillar emphasizes breaking down these silos by enabling data flow and communication between different sub-systems (e.g., BMS, smart meters, occupant devices) to create a holistic view of building operations.
2.3 Inferred Decision Making
Raw data is useless without insight. This involves applying data analytics, machine learning, and statistical models to the collected and interconnected data to infer patterns, diagnose faults, predict demand, and uncover optimization opportunities. This transforms data into actionable intelligence.
2.4 Involve Occupants
Occupant behavior is a major driver of energy use. This area focuses on using data to provide feedback to occupants (via dashboards, alerts, gamification) and potentially allowing them to participate in demand response programs, creating a feedback loop that promotes energy-conscious behavior.
2.5 Intelligent Operations
The culmination of the previous four I's. It refers to the automated or semi-automated control of building systems based on inferred insights and occupant feedback. Examples include optimizing HVAC schedules dynamically, automating lighting based on occupancy and daylight, and participating in grid demand response events autonomously.
Key Insights
- The framework is iterative and interconnected; success in one "I" often depends on progress in others.
- It shifts the focus from isolated data collection to a closed-loop system of measurement, analysis, and action.
- Occupant involvement is critical yet often the most challenging component to implement effectively.
3. Case Study: Non-Intrusive Load Monitoring (NILM)
The paper uses NILM as a well-studied problem that spans all 5 I's. NILM aims to disaggregate total building electricity consumption (from a single smart meter) into individual appliance loads.
- Instrument: Relies on a single, optimally placed smart meter.
- Interconnect: May integrate with other data streams (e.g., time of day, ambient temperature) to improve accuracy.
- Infer: Core of NILM, using signal processing and machine learning algorithms (like Hidden Markov Models) to infer appliance states from aggregate data.
- Involve: Provides detailed appliance-level feedback to occupants, empowering them to change behavior.
- Intelligent Operations: Disaggregated data can trigger automated actions, like shutting down a faulty appliance or scheduling high-load appliances for off-peak hours.
4. Technical Details & Mathematical Formulation
At the heart of inference (I3) and problems like NILM are mathematical models. A common formulation for load disaggregation treats the aggregate power signal $P_{total}(t)$ as a sum of individual appliance power draws plus noise:
$P_{total}(t) = \sum_{i=1}^{N} s_i(t) \cdot P_i(t) + \epsilon(t)$
Where:
- $N$ is the number of appliances.
- $s_i(t)$ is the state (ON/OFF or multi-state) of appliance $i$ at time $t$.
- $P_i(t)$ is the power consumption of appliance $i$ when in the state indicated by $s_i(t)$.
- $\epsilon(t)$ is noise or unmodeled load.
5. Experimental Results & Chart Description
The PDF includes Figure 1, a bar chart titled "Contribution of buildings to overall energy consumption." It compares the percentage of total national energy consumption attributed to buildings across five countries: India, USA, China, Korea, and Australia. The chart visually reinforces the paper's foundational premise, showing that buildings account for a significant and varying share (likely ranging from ~20% to over 40%) of energy use, thereby establishing the high-impact potential of efficiency gains in this sector. While specific numerical results for NILM or other applications are not detailed in the provided excerpt, the framework suggests that successful application of the 5 I's would yield measurable outcomes such as:
- Reduction in overall building energy consumption (kWh).
- Improved accuracy of fault detection (e.g., early detection of HVAC inefficiencies).
- Increased occupant engagement metrics (e.g., dashboard usage, participation in savings programs).
- Cost savings from optimized operations and demand response participation.
6. Analysis Framework: A Non-Code Example
Consider a commercial office building aiming to reduce its cooling load. An analysis following the 5 I's framework would proceed as follows:
- Instrument: Deploy smart thermostats in each zone, power meters on HVAC units, and ambient temperature/humidity/occupancy sensors.
- Interconnect: Stream data from all sensors to a central data platform, correlating occupancy data with HVAC zone temperatures and power draw.
- Infer: Apply analytics to identify patterns: e.g., "Zone A is consistently cooled to 22°C even when occupancy is below 10% after 7 PM," or "Chiller efficiency drops by 15% when outdoor temperature exceeds 35°C."
- Involve: Send weekly reports to facility managers showing wasted cooling hours. Implement a policy allowing occupants to vote on a slight temperature setpoint adjustment during peak summer, linking it to a charity donation for energy saved.
- Intelligent Operations: Automate the HVAC schedule to adopt a "setback" temperature in low-occupancy zones after hours. Integrate with a demand response signal from the utility to temporarily pre-cool the building before a peak event.
7. Future Applications & Research Directions
The evolution of the 5 I's framework points towards several future directions:
- AI-Powered Predictive Control: Moving from rule-based to deep reinforcement learning models that can continuously learn and optimize building operations in real-time, akin to how AlphaGo mastered Go.
- Grid-Interactive Efficient Buildings (GEB): Deepening the "Intelligent Operations" pillar to make buildings active, dynamic participants in the smart grid, providing grid services like frequency regulation.
- Privacy-Preserving Analytics: Developing federated learning or advanced anonymization techniques to enable inference and collaboration (I2, I3) without compromising occupant privacy, a major concern with fine-grained data.
- Digital Twins: Creating high-fidelity virtual models of buildings that are continuously updated with sensor data (I1, I2), enabling simulation, scenario planning, and proactive maintenance (I3, I5).
- Human-in-the-Loop AI: Enhancing "Involve Occupants" (I4) with more sophisticated behavioral models and adaptive interfaces that personalize feedback and incentives, increasing efficacy.
8. References
- Batra, N., Singh, A., Singh, P., Dutta, H., Sarangan, V., & Srivastava, M. (2014). Data Driven Energy Efficiency in Buildings. arXiv preprint arXiv:1404.7227.
- U.S. Department of Energy. (2023). Grid-Interactive Efficient Buildings. Retrieved from https://www.energy.gov/eere/buildings/grid-interactive-efficient-buildings
- Zhu, J., Park, T., Isola, P., & Efros, A. A. (2017). Unpaired Image-to-Image Translation using Cycle-Consistent Adversarial Networks. Proceedings of the IEEE International Conference on Computer Vision (ICCV). (CycleGAN reference for generative AI analogy).
- International Energy Agency (IEA). (2022). Buildings. Retrieved from https://www.iea.org/topics/buildings
- Kolter, J. Z., & Johnson, M. J. (2011). REDD: A Public Data Set for Energy Disaggregation Research. Proceedings of the SustKDD Workshop.
9. Original Analysis & Critical Review
Core Insight: Batra et al.'s "5 I's" framework isn't just a taxonomy; it's a maturity model for the building energy sector's digital transformation. The paper correctly identifies that the real bottleneck is no longer data collection (I1), but the systemic integration and intelligent application of that data (I2-I5). This mirrors the evolution seen in other data-intensive fields, such as computer vision, where the creation of large, standardized datasets like ImageNet or MNIST (referenced in the PDF) was the catalyst for an AI revolution. The building sector is now assembling its "ImageNet" through smart meters and BMS, but the algorithms and business models for leveraging it are still in their adolescence.
Logical Flow & Strengths: The framework's strength lies in its holistic, closed-loop logic. It correctly sequences the journey from physical instrumentation to automated action, emphasizing that data without inference is noise, and insight without action is academic. The inclusion of "Involve Occupants" (I4) is particularly prescient, acknowledging that the most advanced AI control system can be undone by human behavior—a lesson often learned the hard way in real-world deployments. Using NILM as a cross-cutting case study is an excellent pedagogical choice, making the abstract framework tangible.
Flaws & Gaps: The primary flaw, common to framework papers of its era (2014), is its understatement of the monumental challenges in "Interconnect" (I2). The paper mentions siloed systems but doesn't fully grapple with the legacy infrastructure, proprietary protocols (BACnet, Modbus), and cybersecurity risks that make data integration a costly and complex engineering nightmare, not just a conceptual step. Furthermore, while it nods to privacy, the profound privacy implications of the fine-grained behavioral data required for I3 and I4 are not critically examined. The framework also leans heavily on a techno-optimistic view; it underplays the organizational and financial barriers to adoption, especially in the fragmented real estate market.
Actionable Insights & Future View: For practitioners, the actionable insight is to stop pursuing "I's" in isolation. Installing 10,000 sensors (I1) without a plan for I3 and I5 is a waste. Start with a clear use case (e.g., peak shaving, fault detection) and work backwards through the framework. The future lies in moving from descriptive/prescriptive analytics to generative and autonomous systems. Imagine a "CycleGAN for buildings": a system that not only diagnoses inefficiency but generates and simulates multiple optimized control strategies (like GANs generating images) before deploying the best one. The integration with large-scale renewable energy and vehicle-to-grid (V2G) systems will be the next frontier, transforming buildings from passive consumers to active nodes in a fully decarbonized, resilient energy internet. The 5 I's provide the foundational blueprint, but the next decade will be about building the AI "brains" and the interoperable "nervous system" to make it a reality.